Data & geospatial design studio

Beautiful and actionable location intelligence

Develop fluid and immersive mapping experiences with robust data pipelines across APIs, databases, and more.

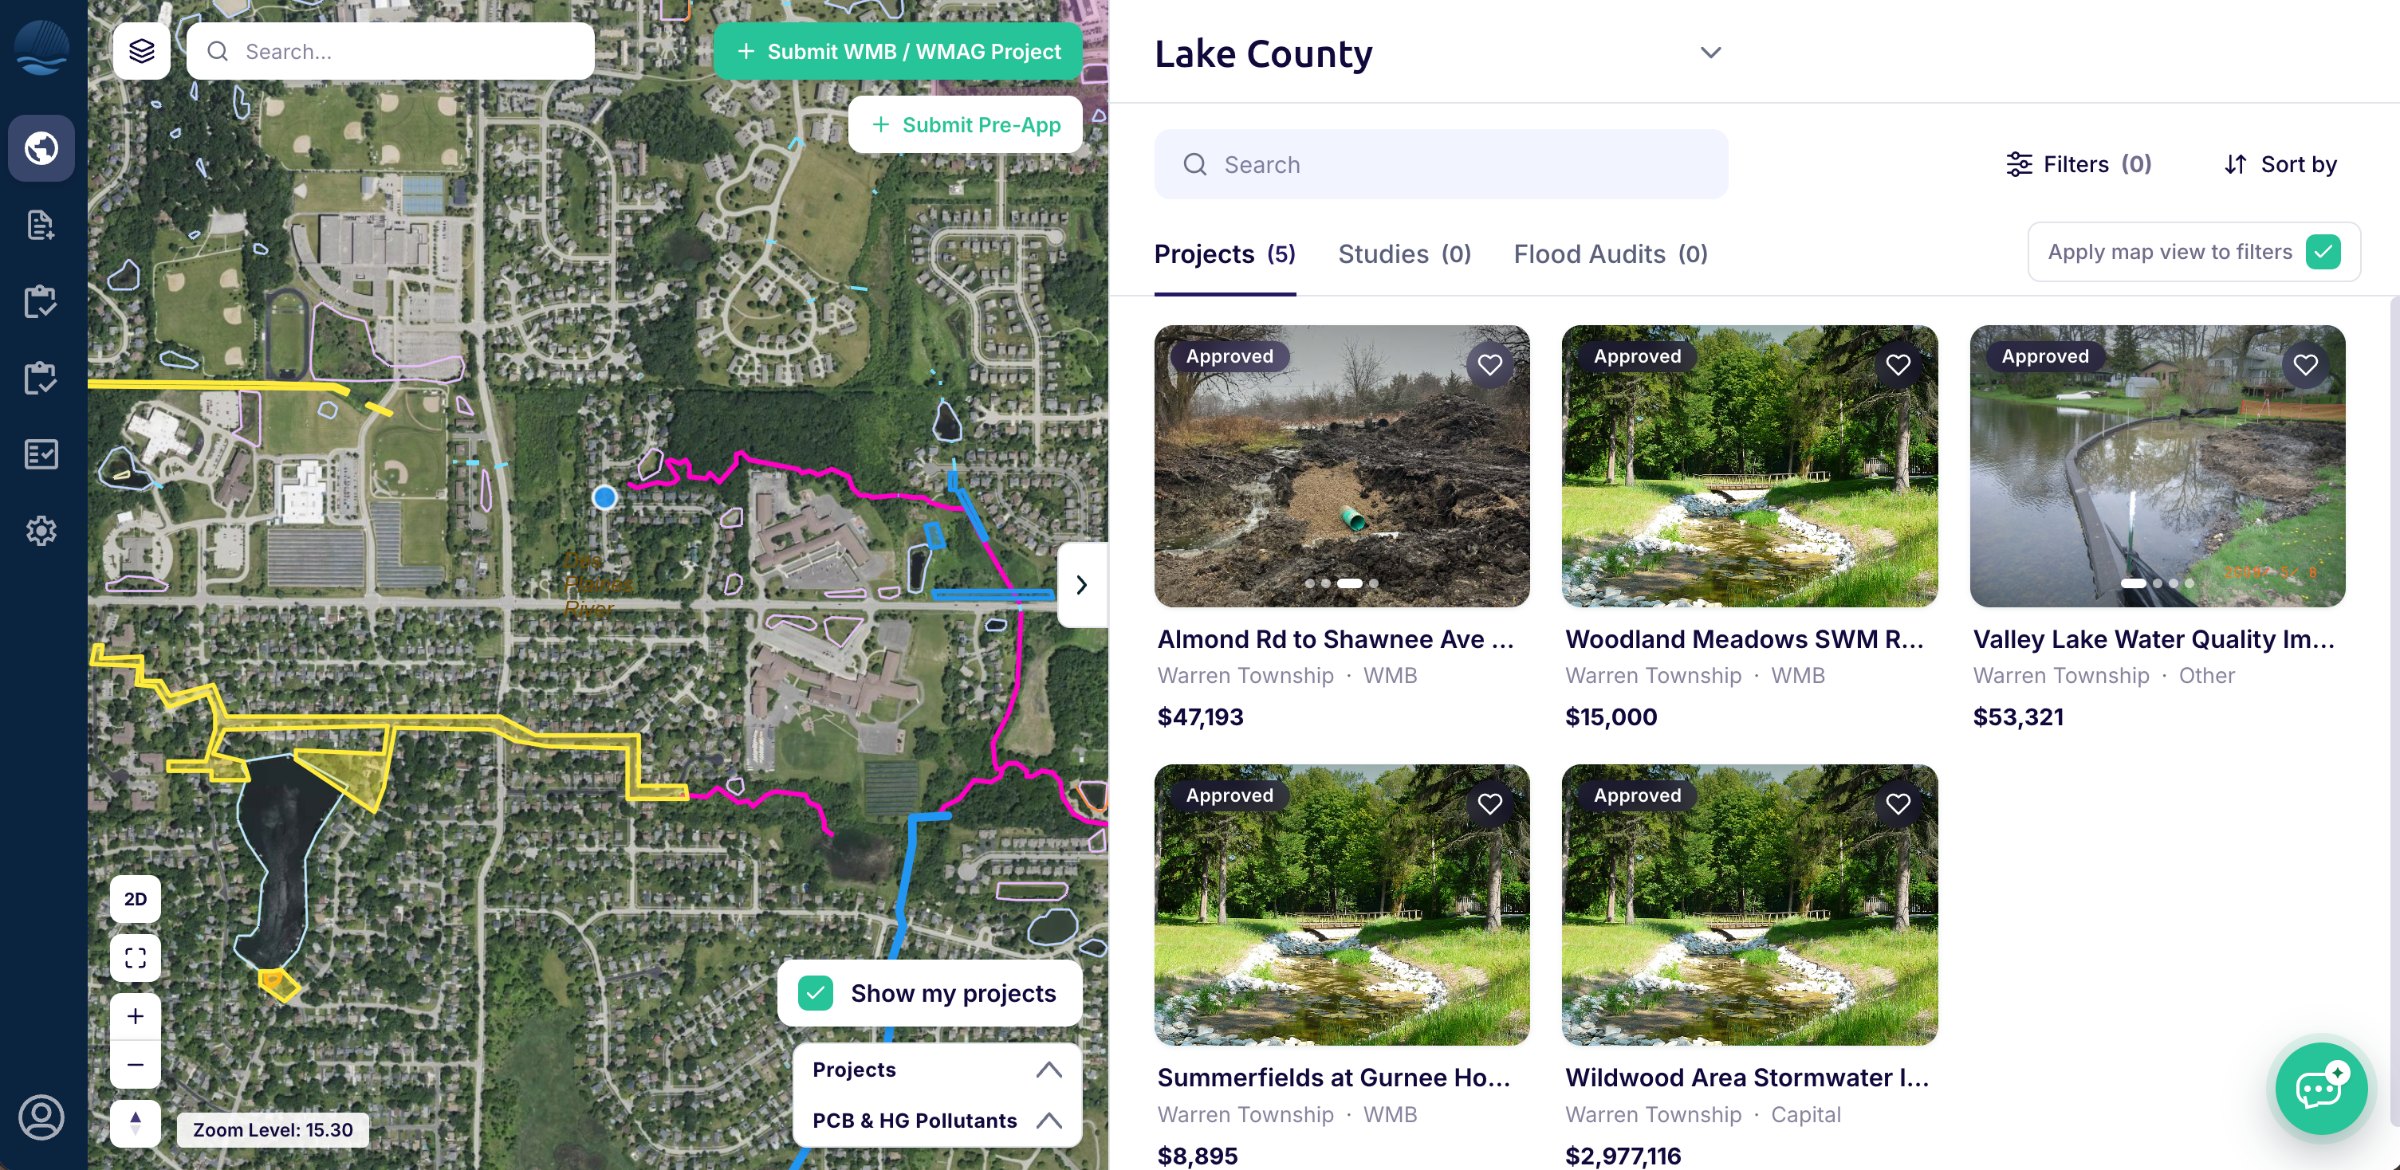
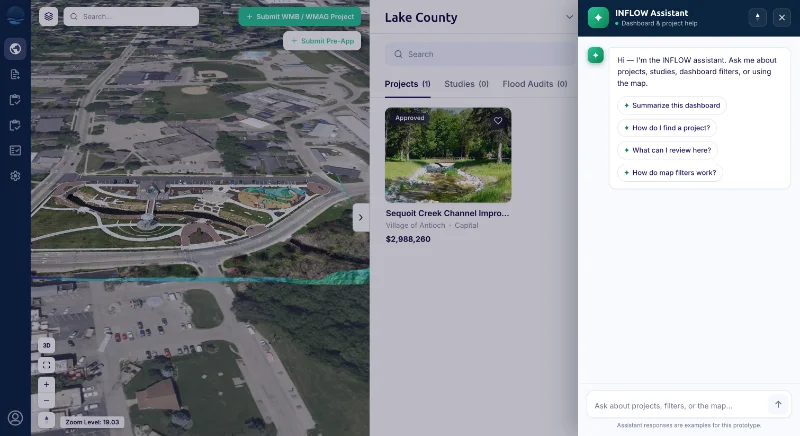
Map of Lake County stormwater projects
TRUSTED BY
United Nations
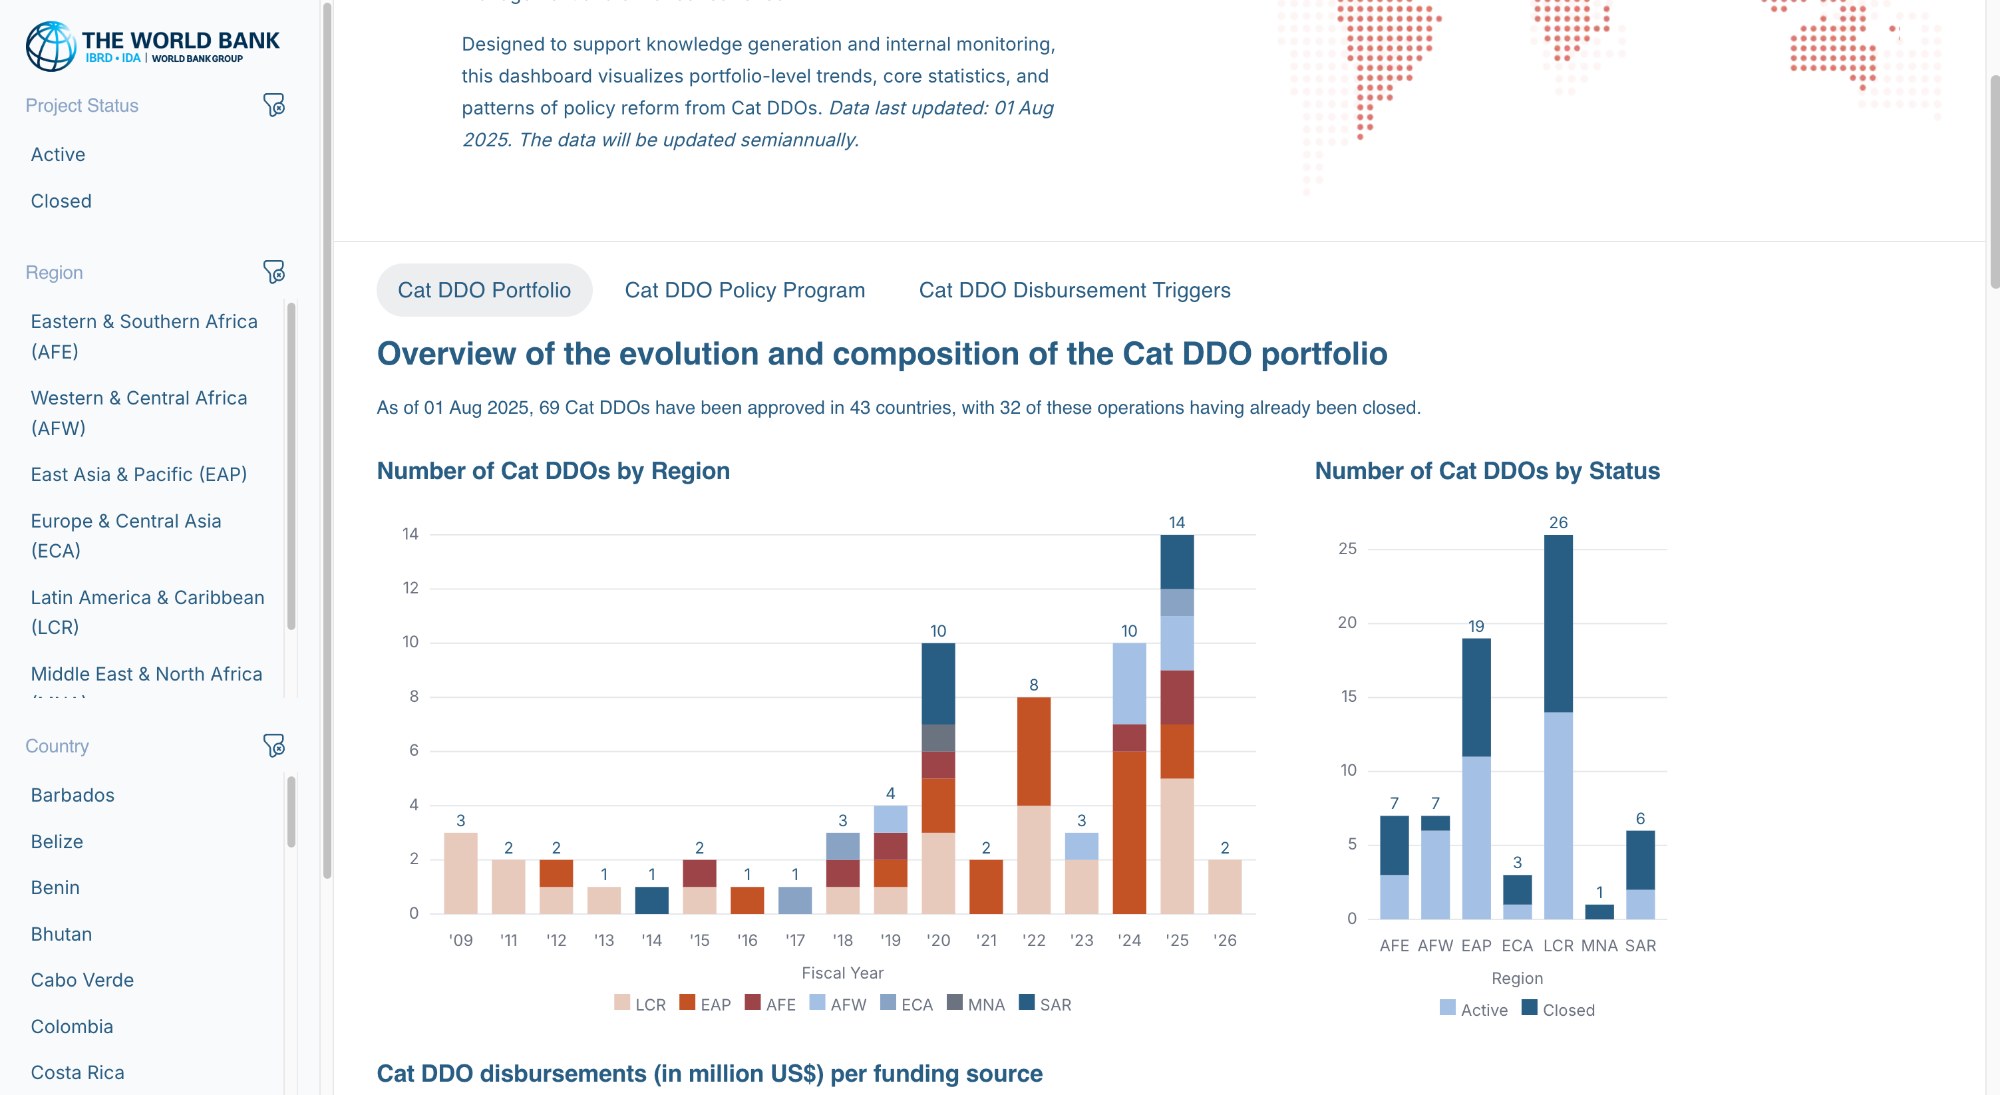
The World Bank
World Resources Institute
Pfizer
Siemens
CARTO
Inter-American Development Bank
DC.gov
AECOM
Lake County
Calibre
WWF
Data visualization

Let your data communicate a compelling story

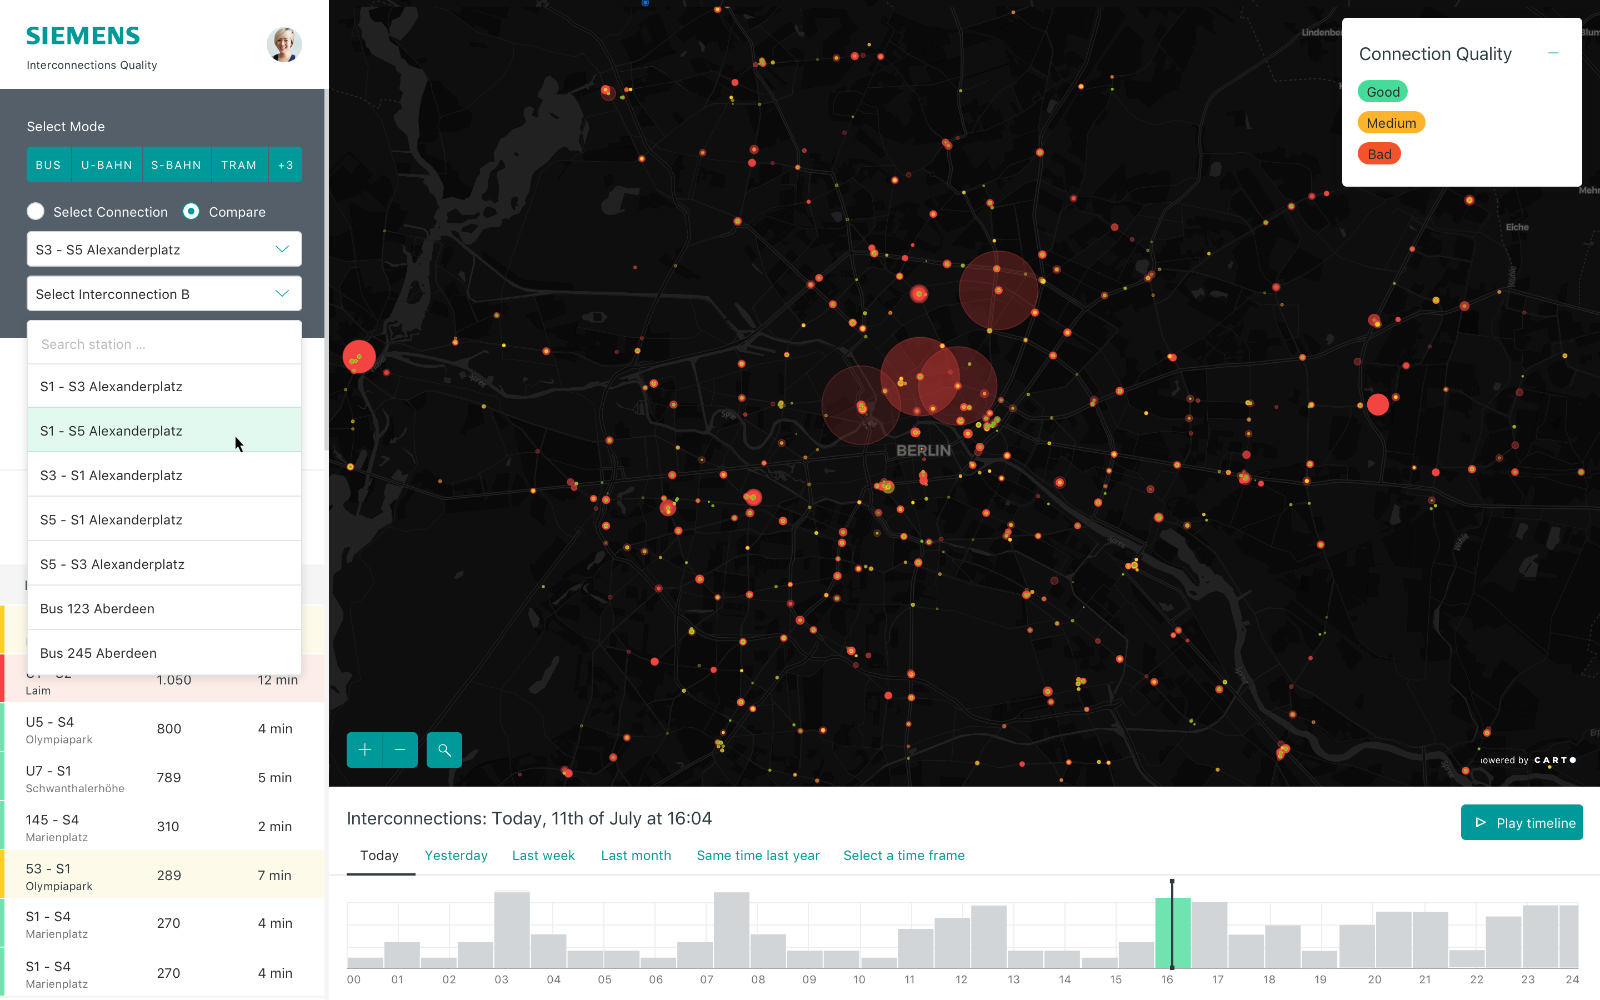
Our solutions integrate mapping and graphics seamlessly for a multi-point-of-view analysis. Whether it is viewing train occupancy levels for Siemens or KPIs for the World Bank, our dashboards provide the unique insights needed that big box solutions cannot meet.

Inflow/ Lake County Stormwater Management Commission
View live
InFlow dashboard for Lake County
Data architecture

Centralize your data

Vizonomy will work with your team to determine the best data architecture: whether it's synchronizing ESRI service layers into your map or creating new data tables in a cloud environment.

Whether we stream your data synchronously via API or store it in Postgres, MongoDB, or other location, we'll ensure high performance for the most demanding analysis.

01CARTO
02MAPBOX
03ESRI ARCGIS
04POSTGRES
05MONGODB
06REST APIS
07REACT
08NODE
09UNITY
10SATELLITE IMAGERY
11DRONE CAPTURE
12CROWDSOURCED DATA
Services

Shaping a vision, delivering software, creating world class experiences

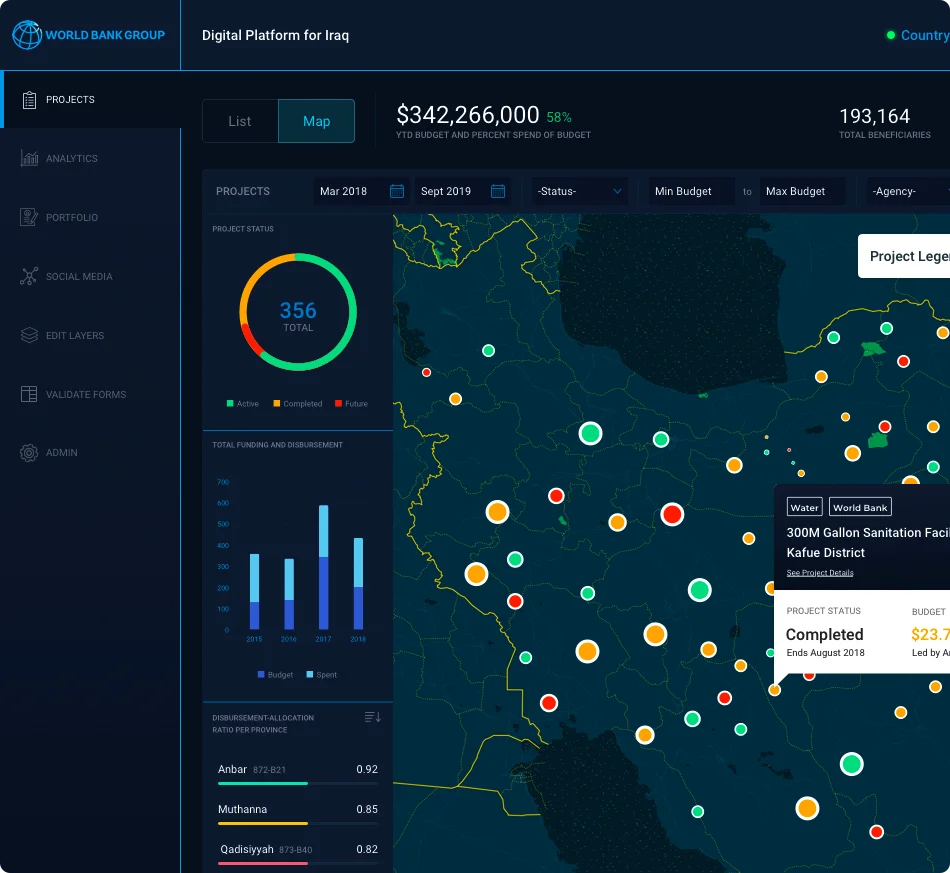
World Bank CAT DDO Dashboard

We partner with forward thinking agencies and brands globally to create connected design experiences. Those include delivering products centered on data visualization, geospatial analysis, mobile and web, and augmented reality.

Designed with intent →
01
User experience
Craft user roles and workflow with our dedicated design sprint team. Empathize with your audience and be strategic in your design decisions.
02
GIS & web mapping
Develop fluid and immersive mapping experiences with robust data pipelines across APIs, databases, and more.

03
Data visualization
Offer beautiful visualizations from the most commonplace to the most unique. Simplify complexity with custom dashboards.
04
Mobile & web
Responsive design leveraging the most modern web frameworks from React, Node, and Bootstrap.
Custom dashboards

Data visualization through open source

We design our dashboards with the intent to give your audience a powerful tool to drill down, highlight, and filter your data on the fly. Include maps. Connect to your internal systems. Or collect data from the crowd. Everything is possible.
MOST COMMON REQUESTS
01Customize pop-ups for each graphic and map feature
02Filter maps by graphic selection or attribute filter
03Connect to datasets in real-time
04Change colors, title positions, axes, padding and more
05Develop chart types using your brand’s unique style
06Enable mobile-friendly designs
Dashboard chart detail
Partnership

CARTO's lead partner for North America and the United Kingdom

Vizonomy and CARTO are developing customized location-based solutions that are beautiful, insightful and effective. Powered by CARTO and designed by Vizonomy, we are going beyond the typical out-of-the-box solution, with analytics, graphics, and other features that our varied clients demand.

Go to CARTO →
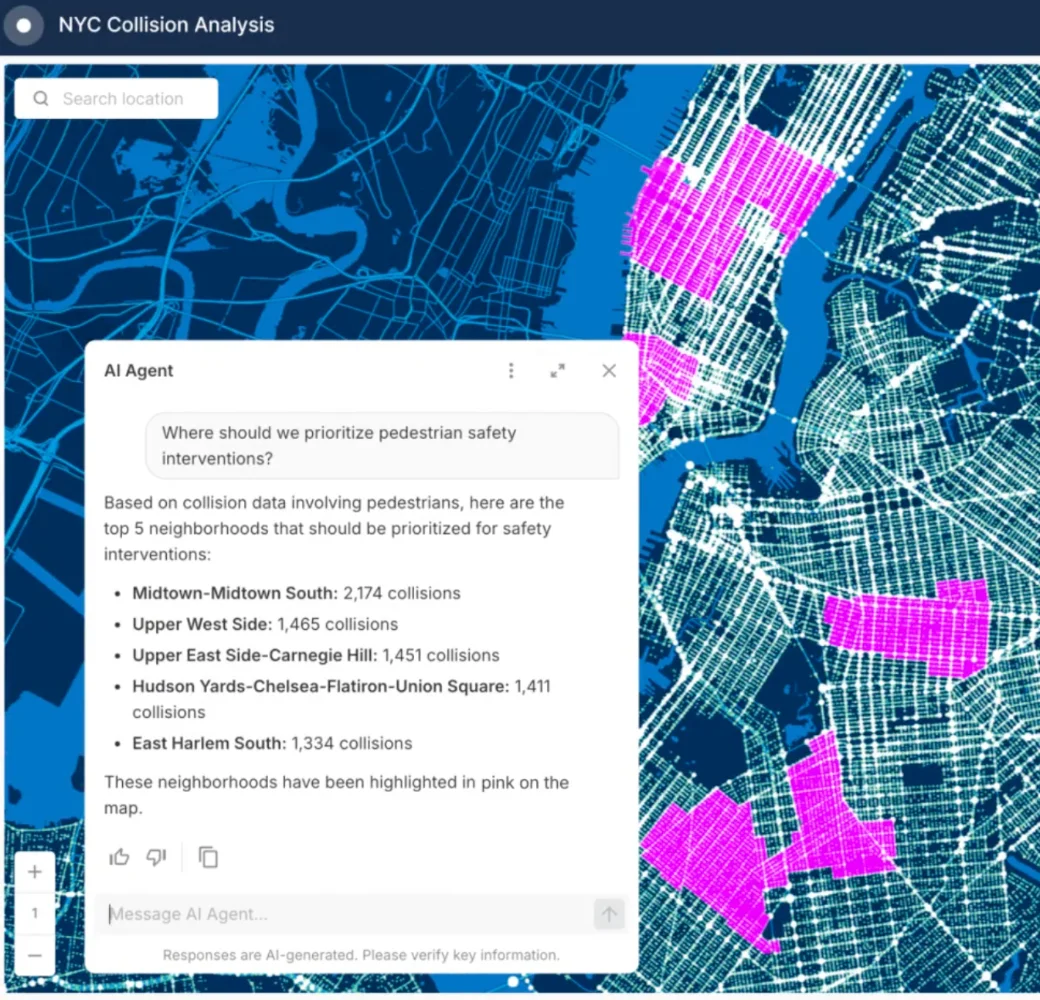
NYC Collision Analysis with AI Agent
Augmented reality

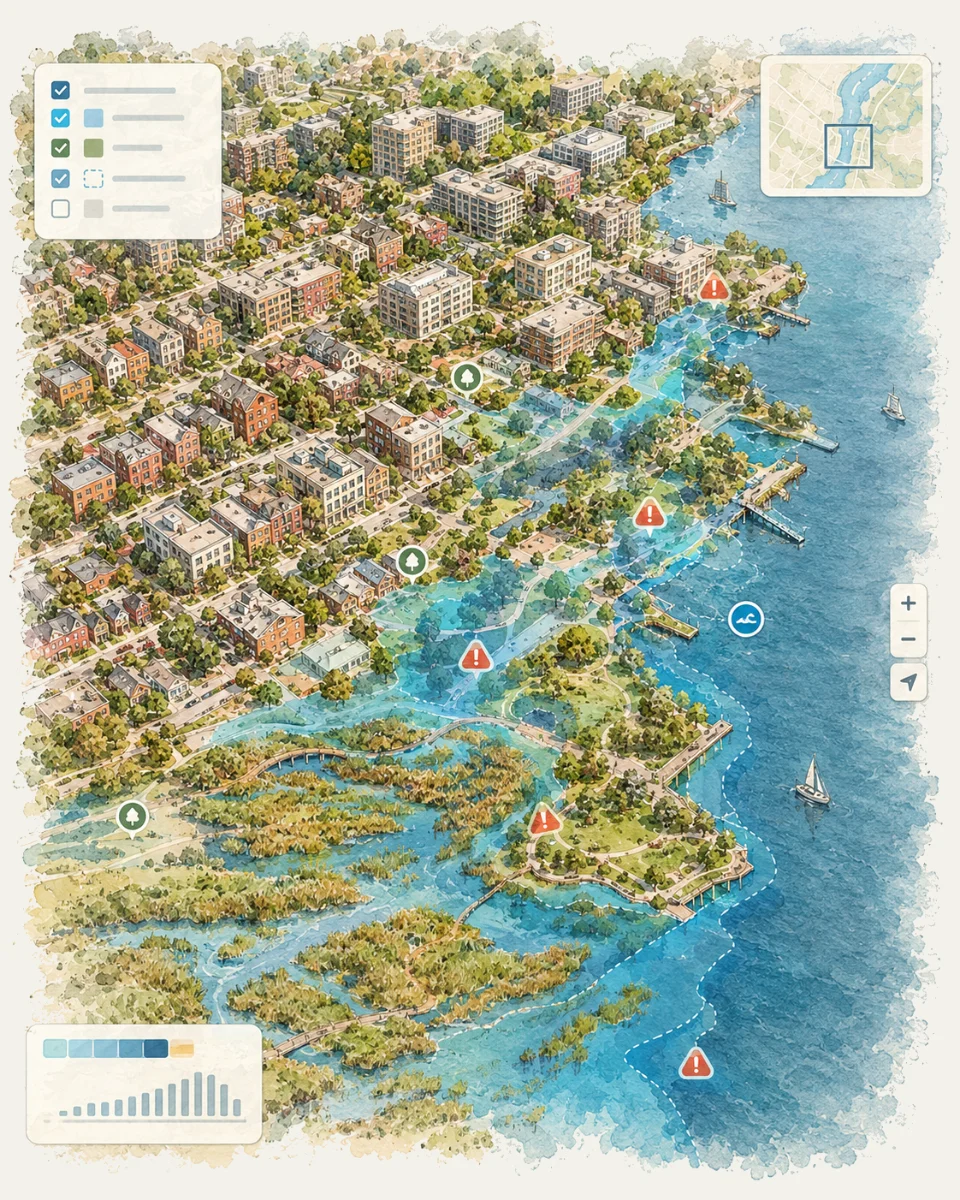
Your city, on top of a table

With the Inter-American Development Bank, Vizonomy is using drones to develop a 3D rendering of small villages in Honduras. Layered with census data and flood risk areas, our dashboards are now in your world: in a meeting, on a table, or any other flat surface.


North Chicago Detention Pond Retrofit project details
CHAMP mobile site
Selected work

Maps, Dashboards, AI Workflows and more.

INFLOW Project Management
ENVIRONMENT · LAKE COUNTY, IL

INFLOW Project Management

Gives county staff one place to track every stormwater project, from first request to final cost, so funding decisions are faster and easier to explain.
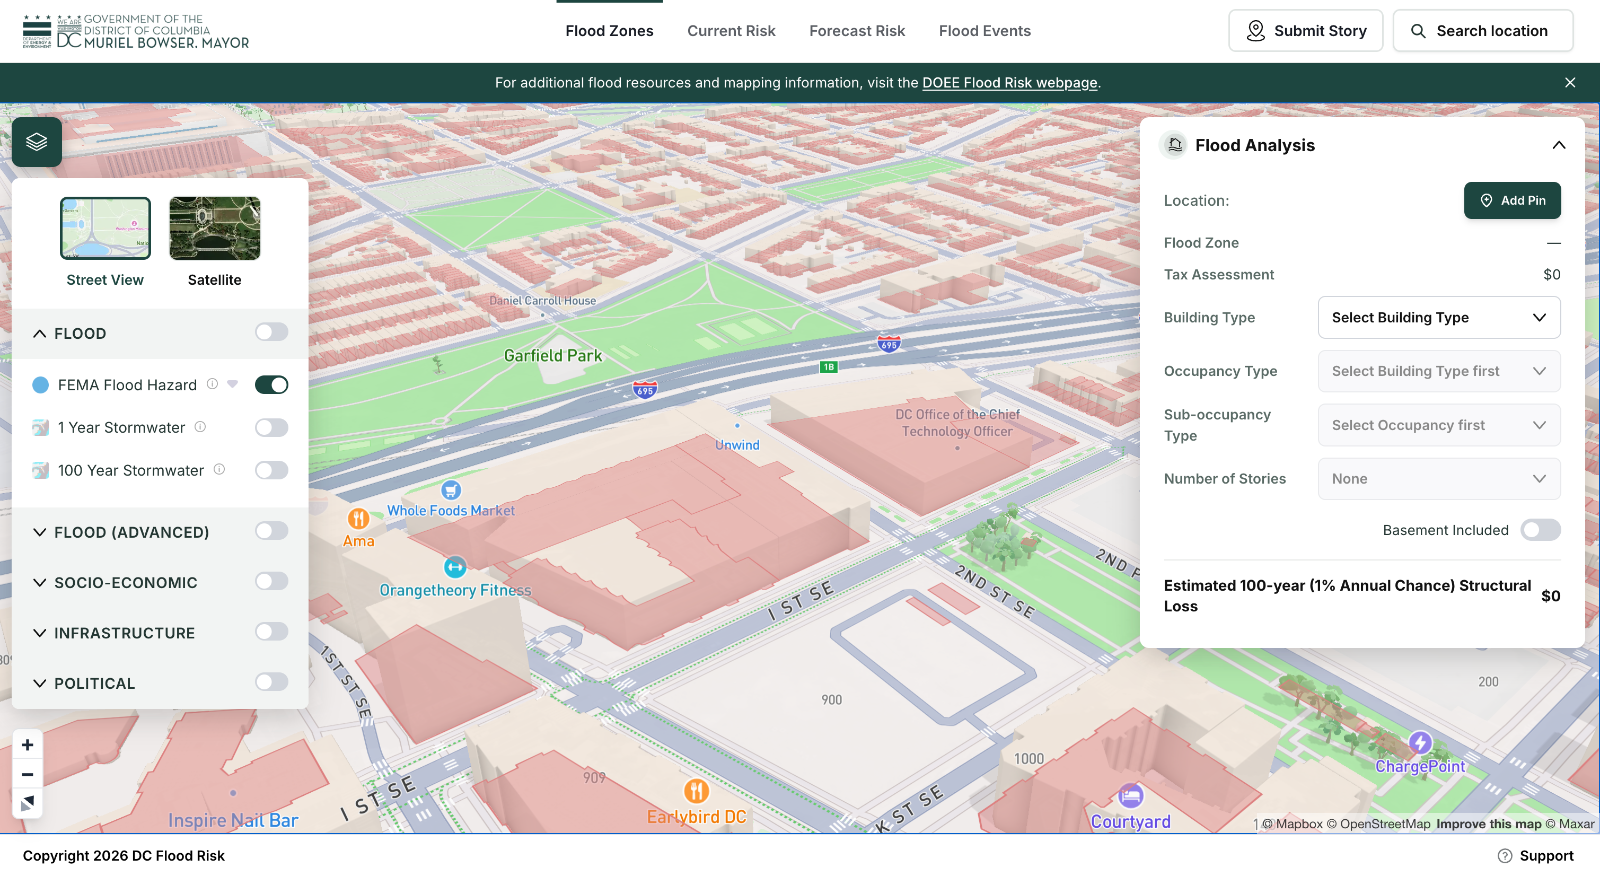
Washington DC Flood Risk Portal
WATER · DISTRICT OF COLUMBIA

Washington DC Flood Risk Portal

Lets residents and property owners look up their flood risk in seconds and understand what it could cost them, before the next storm arrives.
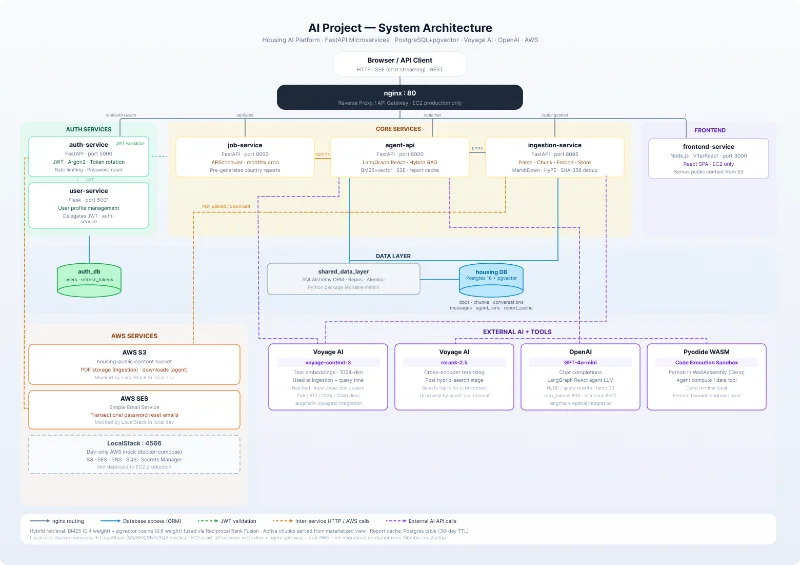
HousingWise AI Platform
HOUSING · THE WORLD BANK GROUP

HousingWise AI Platform

Helps housing teams find answers in their data by simply asking questions, turning hours of research into a short conversation.
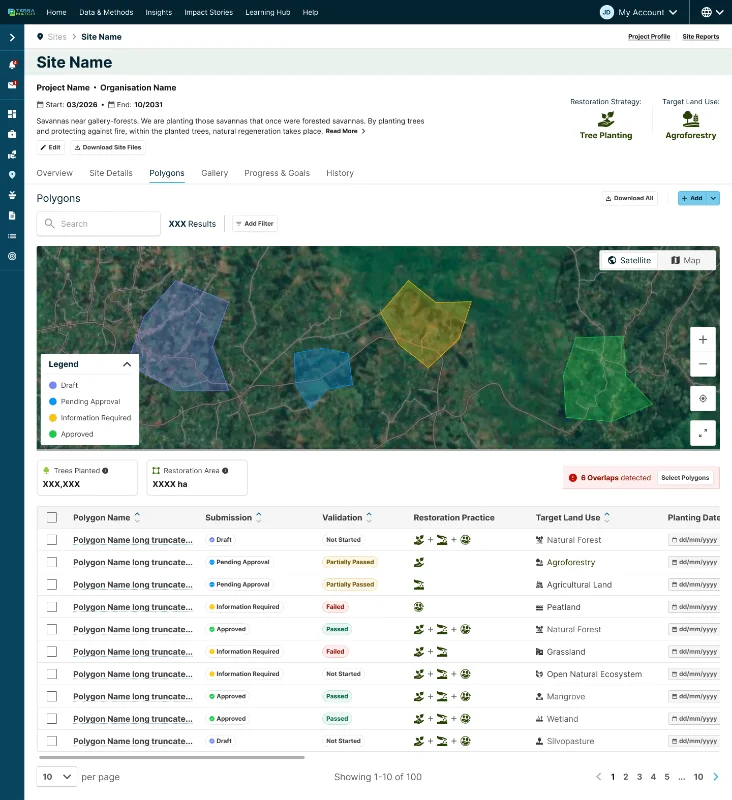
TerraMatch
ENVIRONMENT · WORLD RESOURCES INSTITUTE

TerraMatch

Connects restoration projects with funders and tracks progress on the ground, so more land gets restored with greater confidence.
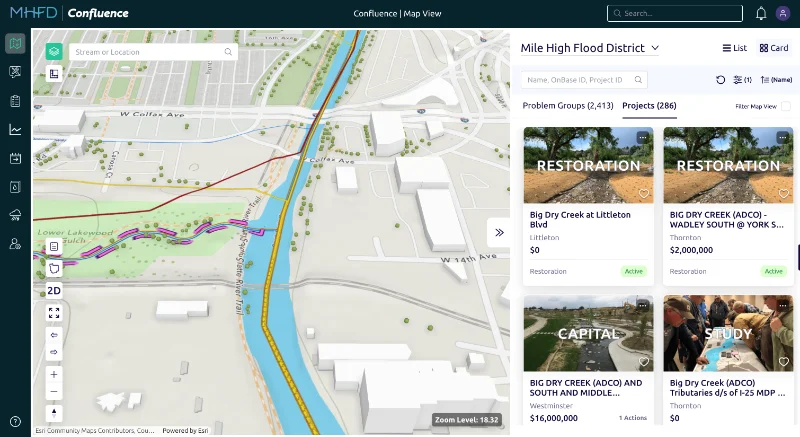
Confluence Project Management
WATER · MILE HIGH FLOOD DISTRICT

Confluence Project Management

Keeps flood control projects on schedule by giving teams a shared view of status, budgets and next steps across the district.
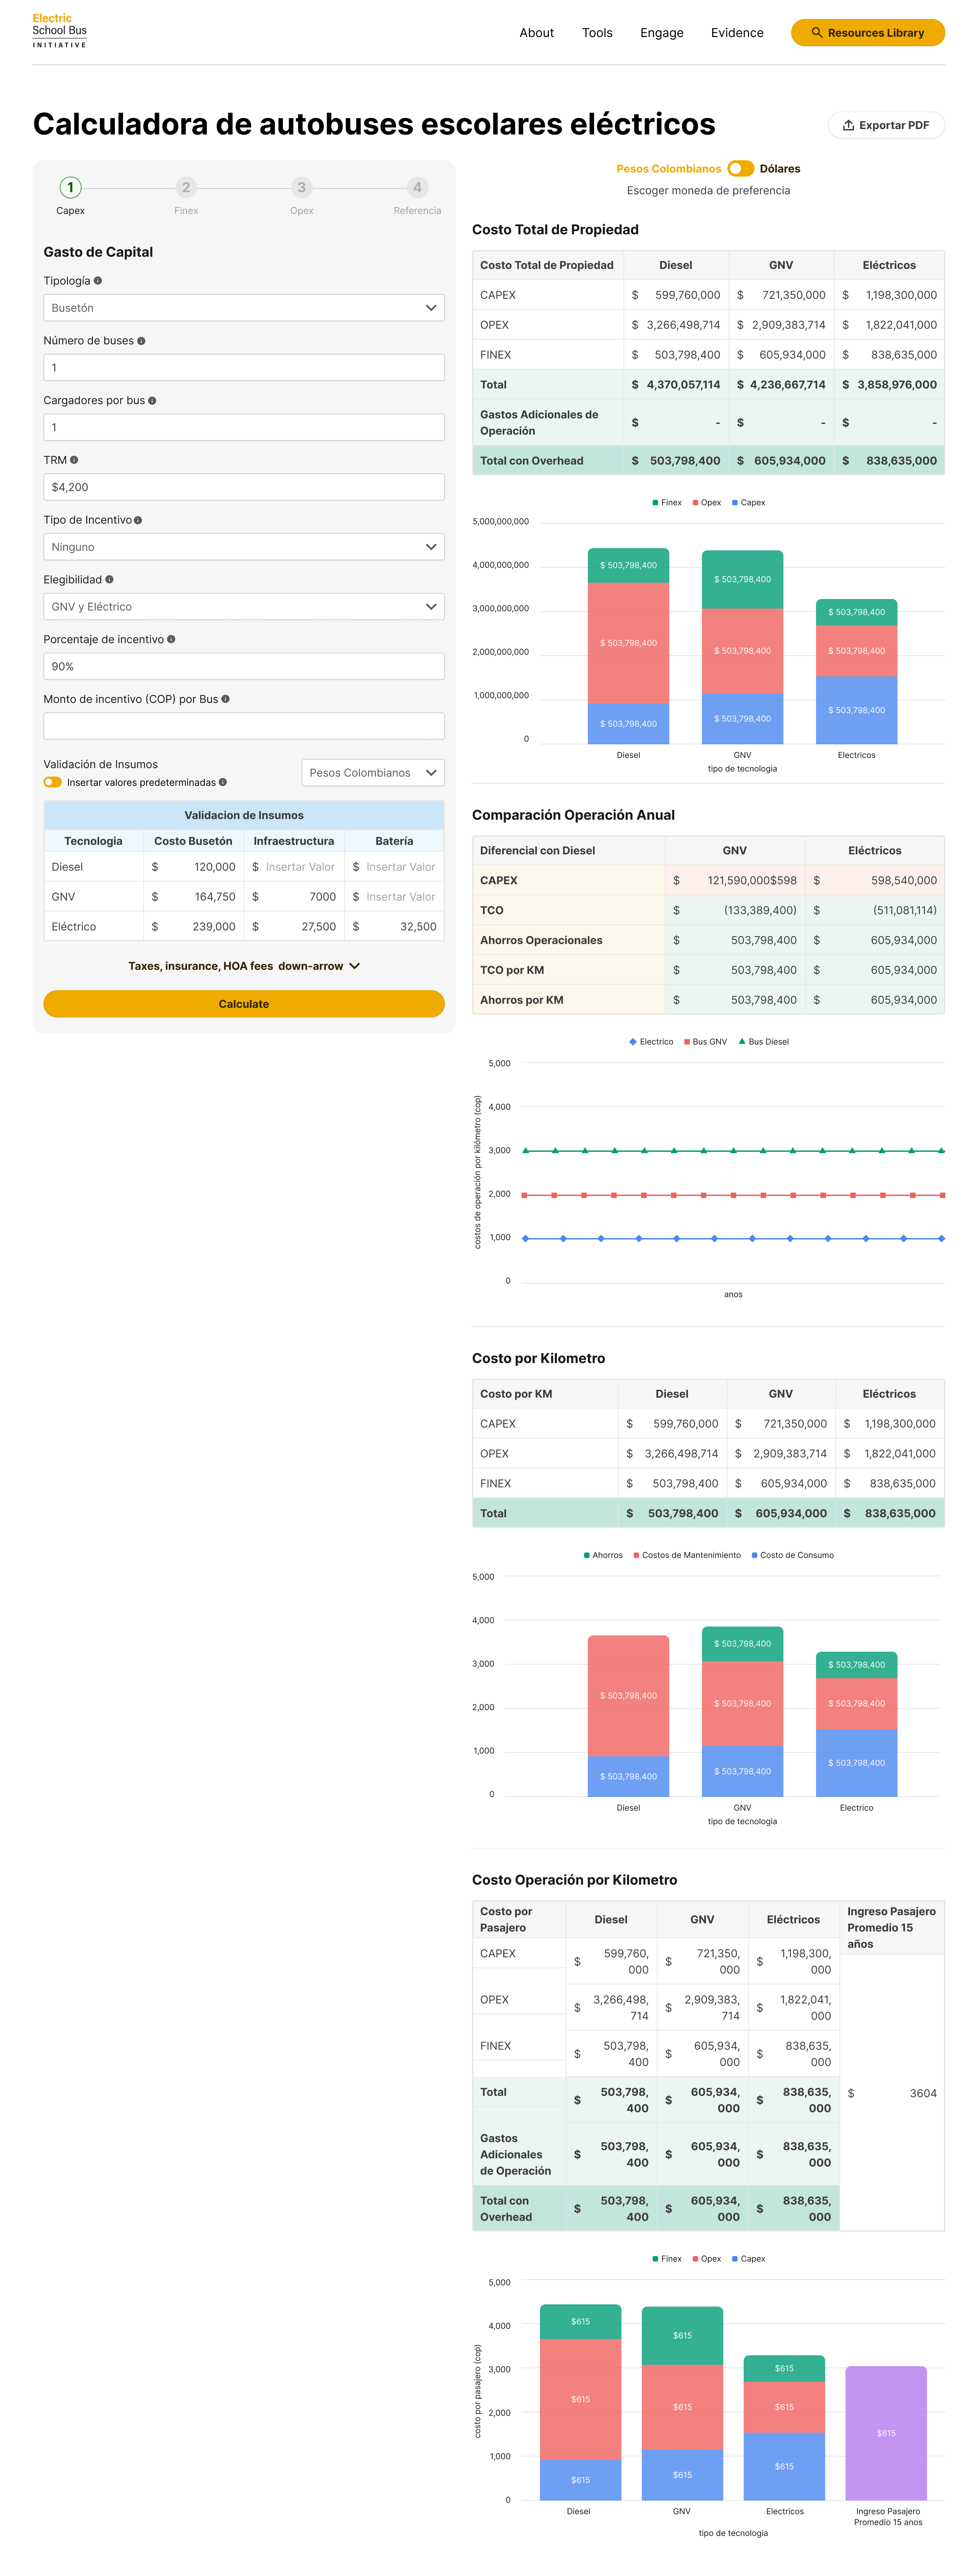
Electric Bus Calculator
TRANSPORTATION · WORLD RESOURCE INSTITUTE

Electric Bus Calculator

Shows cities what switching to electric buses would cost and save, making it easier to plan cleaner public transit.
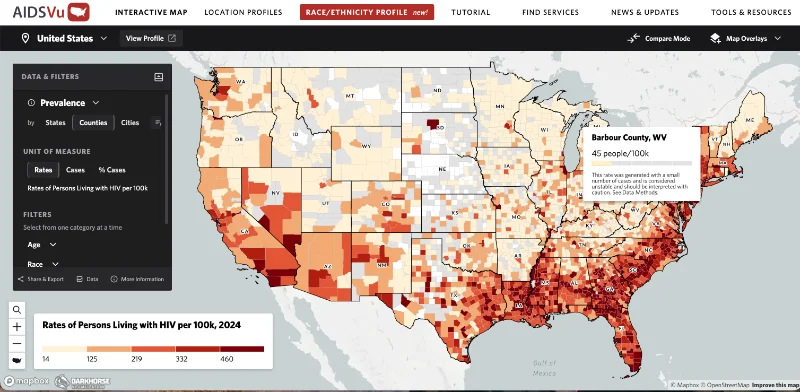
AIDSVU
HEALTH · THE SIGNAL GROUP

AIDSVU

Makes national HIV data easy to explore, helping communities and health workers see where testing and care are needed most.
Train occupancy dashboard
TRANSPORTATION · SIEMENS

Train occupancy dashboard

Shows operators where passengers wait longest between connections, so service can be adjusted where riders feel it most.
Start a project

The world of visualization at your fingertips

Bring us your data. We'll design the maps, dashboards and tools around it.